Study: How much research participants want to be paid
By Ian Floyd and The Decision Lab●9 min. read●Dec 11, 2025
Good research is almost always incentivized — people want payment for taking part in studies. But how much should you research participants?
Deciding on the right incentive amount is a delicate problem: pay too little, and you won't get enough participants. Pay too much, and you blow up your budget. We did some research to find out the right amount of payment to offer to keep both your participants and your budget happy.
Calculate an incentive in seconds
Just looking for an answer? Try our research incentive calculator and learn how much to pay your research participants.
We’re not the first to try to figure out how much to pay participants. Other companies have created incentive calculators based on historical data. They’re valuable and insightful. But their work is retrospective in nature. It’s an analysis of the status quo — how thousands of researchers have paid participants for various types of research in the past.
We took a different approach. In partnership with The Decision Lab, we used conjoint analyses on over 3,000 data points to measure what reimbursements participants actually want. You can read the full methodology at the end.
For our research, we considered a number of sub-questions:
How much should you pay for a survey versus an interview?
How much should you increase the incentive by if it’s a 5-minute commitment, a 15-minute one, or something much longer?
Does it matter if the research is about a sensitive topic compared to something surface-level?
To what degree does the preferences of your target population matter?
How do participants value (or devalue) different incentive types, like cash, Amazon gift cards, Visa prepaid cards, and charitable donations?
With this approach, we’ve been able to measure how the individual variables interact and impact how much you should offer.
With this guide, we’ll help you get the most bang for your buck — while still doing right by the people at the heart of your study.
How to approach research incentives, at a glance
We’ve got a super-short answer, a shorter answer, and the long answer.
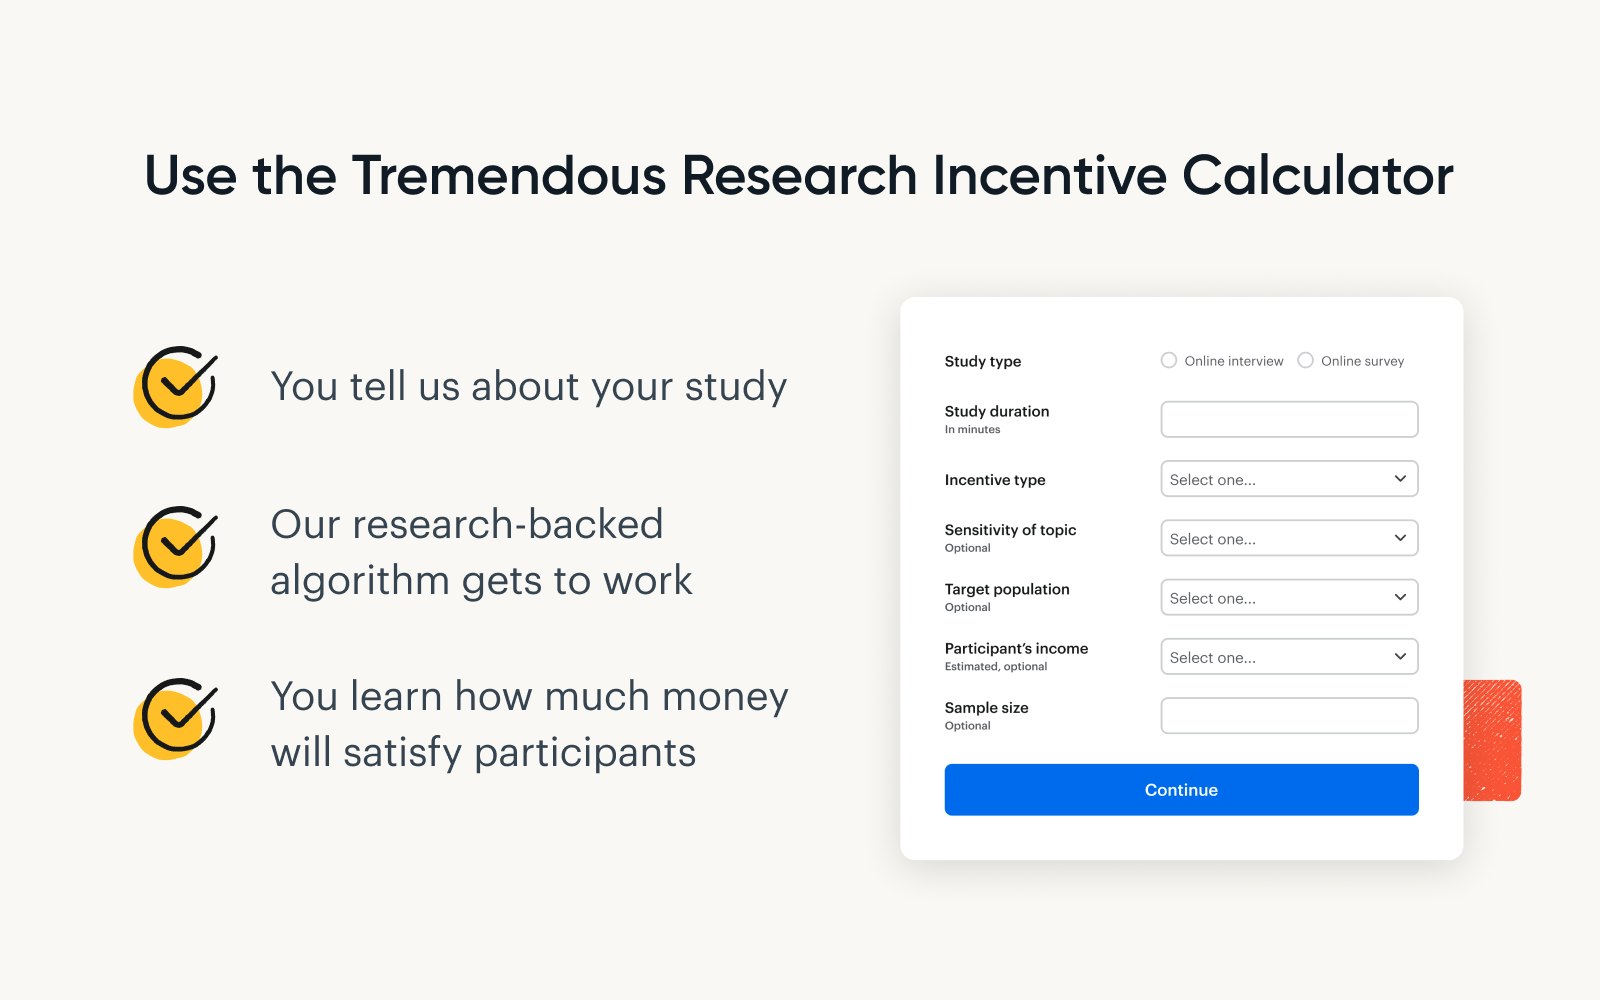
Super-short answer: Answer a few questions about your study and the Tremendous Research Incentive Calculator will suggest how much to offer.
Short answer:
As a base, you should pay participants $1.76 per minute. As duration increases, the cost-per-minute gets cheaper. (We explain why below.)
Interviews cost more than surveys. For a 30-minute interview you should pay about $57, compared to $48 for a survey.
Students are comfortable with a lower rate than those in the workforce. And, people earning $200,000 or more expect much higher compensation for their time.
And it also matters how you send the incentive.
In a separate survey of Tremendous clients, we found that 49% incentivized research using Amazon.com gift cards prior to switching to Tremendous. Yet, in our research with The Decision Lab, we discovered that most participants don’t want to be boxed into a single retailer (even if that retailer is Amazon).
Some highlights from our research
Research participants primarily want to be paid in cash transfers. You have to offer more to achieve the same perceived value when using other payout options, such as Visa or Amazon gift cards.
However, you need to balance what recipients most want against your own operational needs.
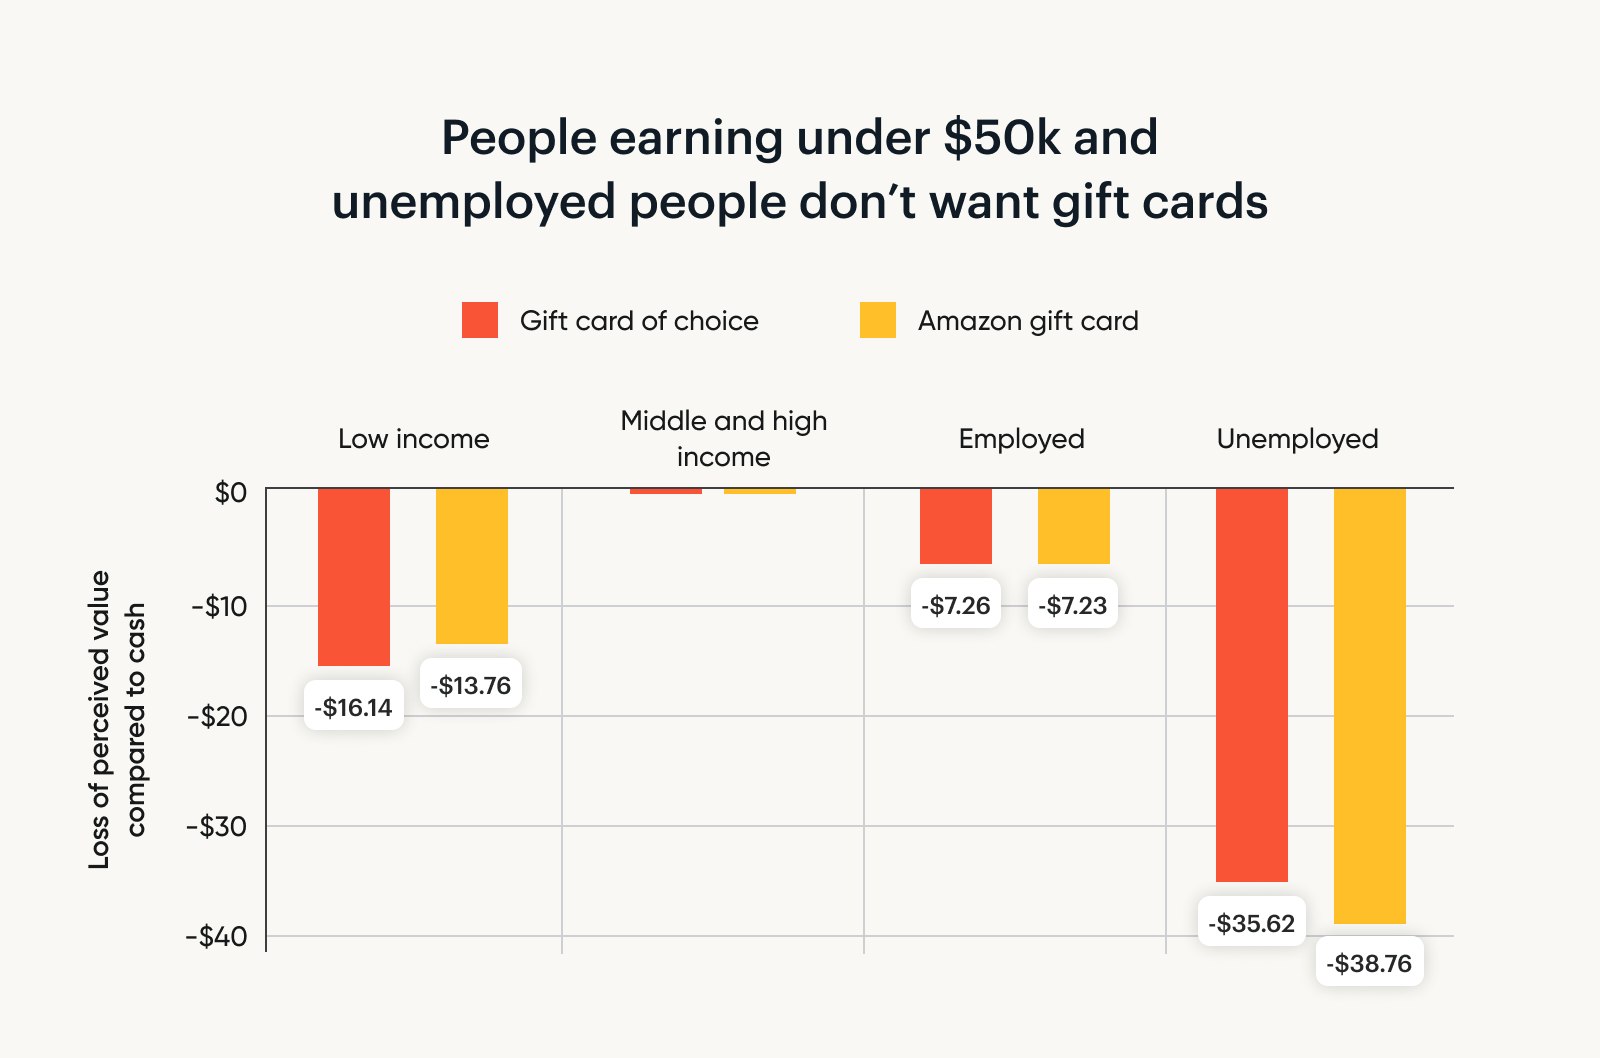
People who earn more than $50,000 a year always welcome a gift card when they’re given the ability to select one from a list of retailers.
People dealing with unemployment want over $35 more if they’re paid with a gift card (compared to cash transfers).
If you are an occasional researcher, this might be enough information for you to go on. If figuring out how much (and how) to pay subjects is a meaningful part of your work, you might want to keep reading.
Step 1: Figure out how long your study takes
Time is the most important variable to prospective participants. So the first step to finding the optimal incentive is to figure out how much time you’re asking of participants.
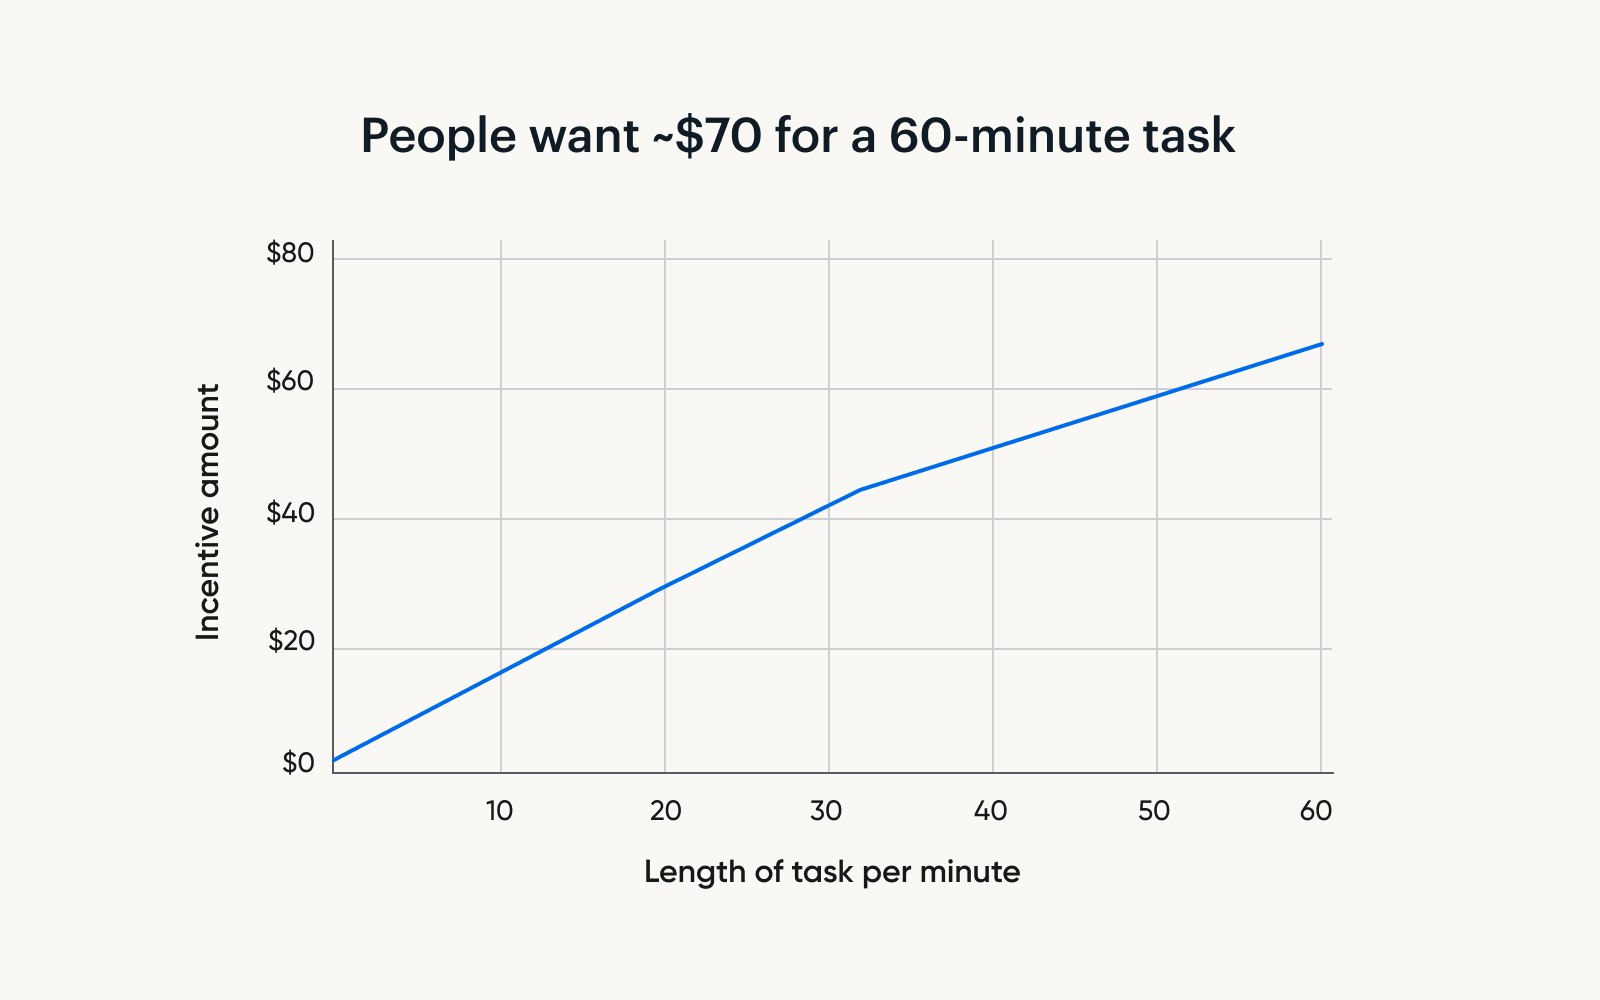
For the sake of simplicity, we’ll share some heuristics on how much people want to be paid for tasks with a few different lengths:
15-minute task: People want to be paid about $26.
30-minute task: The amount jumps to $48.
60-minute task: People expect a little more than $69.
Keep in mind, though, that you're seeing these numbers in isolation. Once you start factoring in the study type, participant demographics, and other variables, these amounts change.
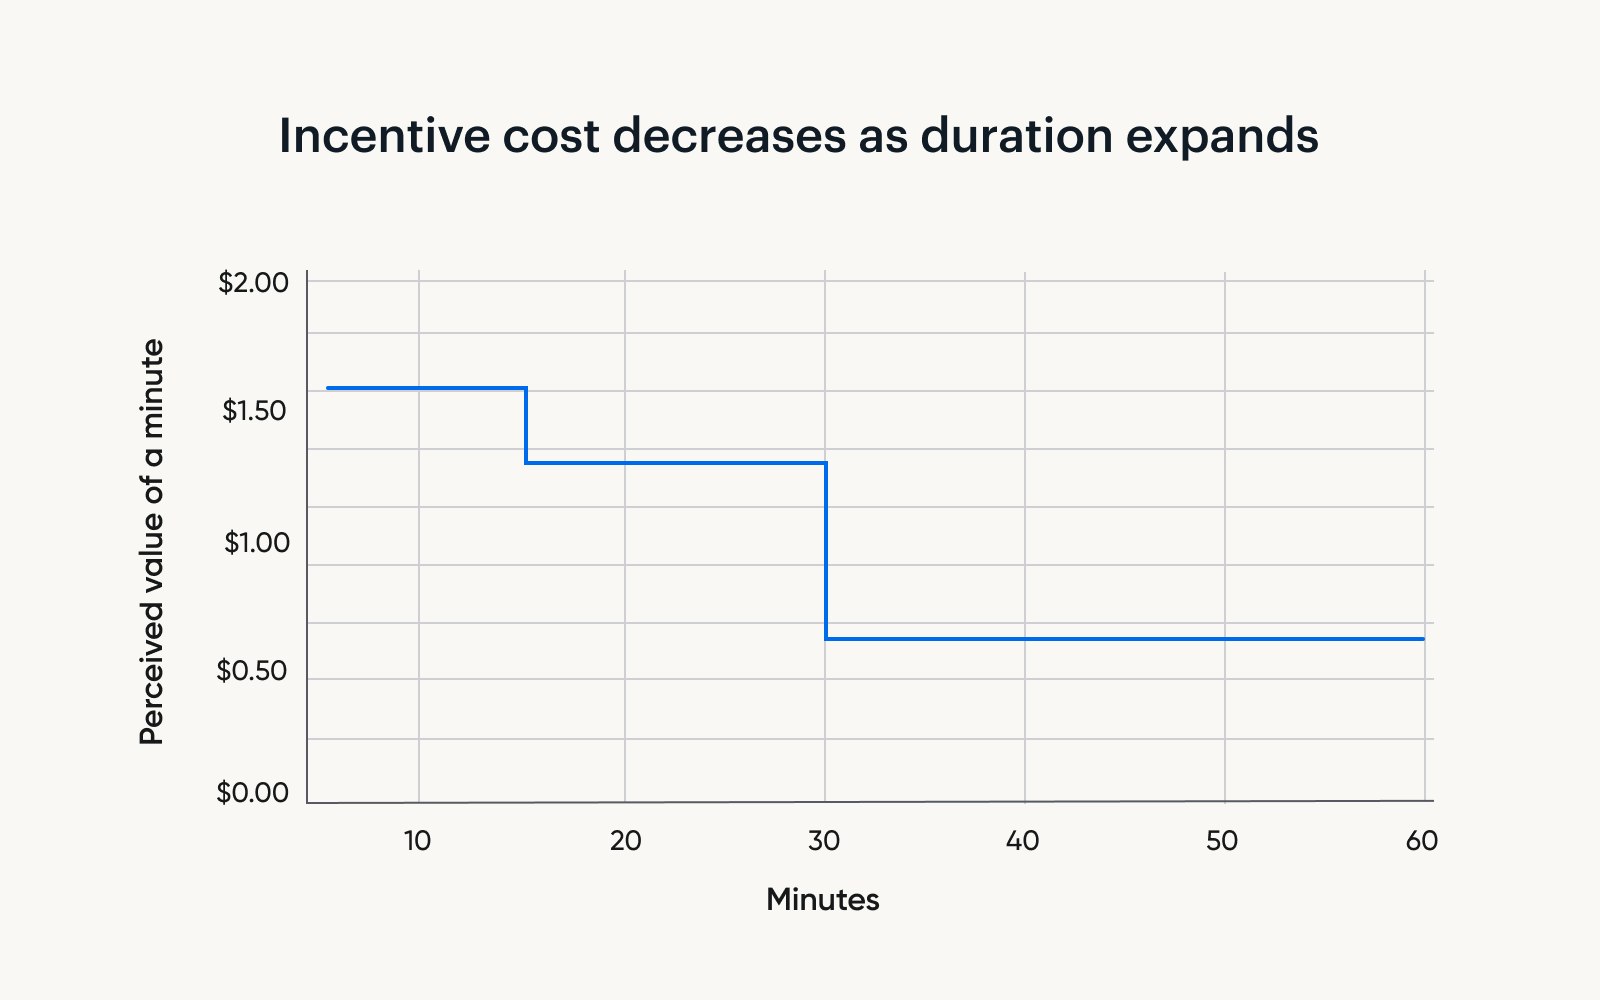
One thing that may surprise you is that the longer your experiment runs, the cheaper each additional minute becomes. For example:
If you increase the length of your study from 5 minutes to 15 minutes, each additional minute costs $1.76.
Now, say you increase the length of your study from 15 to 30 minutes. Each additional minute now costs $1.44.
Finally, say you decide to stretch your interview from 30 minutes to 1 hour. Each additional minute will cost only $0.71.
These findings have important implications for how researchers should approach their experimental designs.
While some researchers worry that increasing study length will impact participant motivation, it may be relatively inexpensive to include additional questions while still adequately compensating respondents.
Step 2: Choose between quantitative versus qualitative research
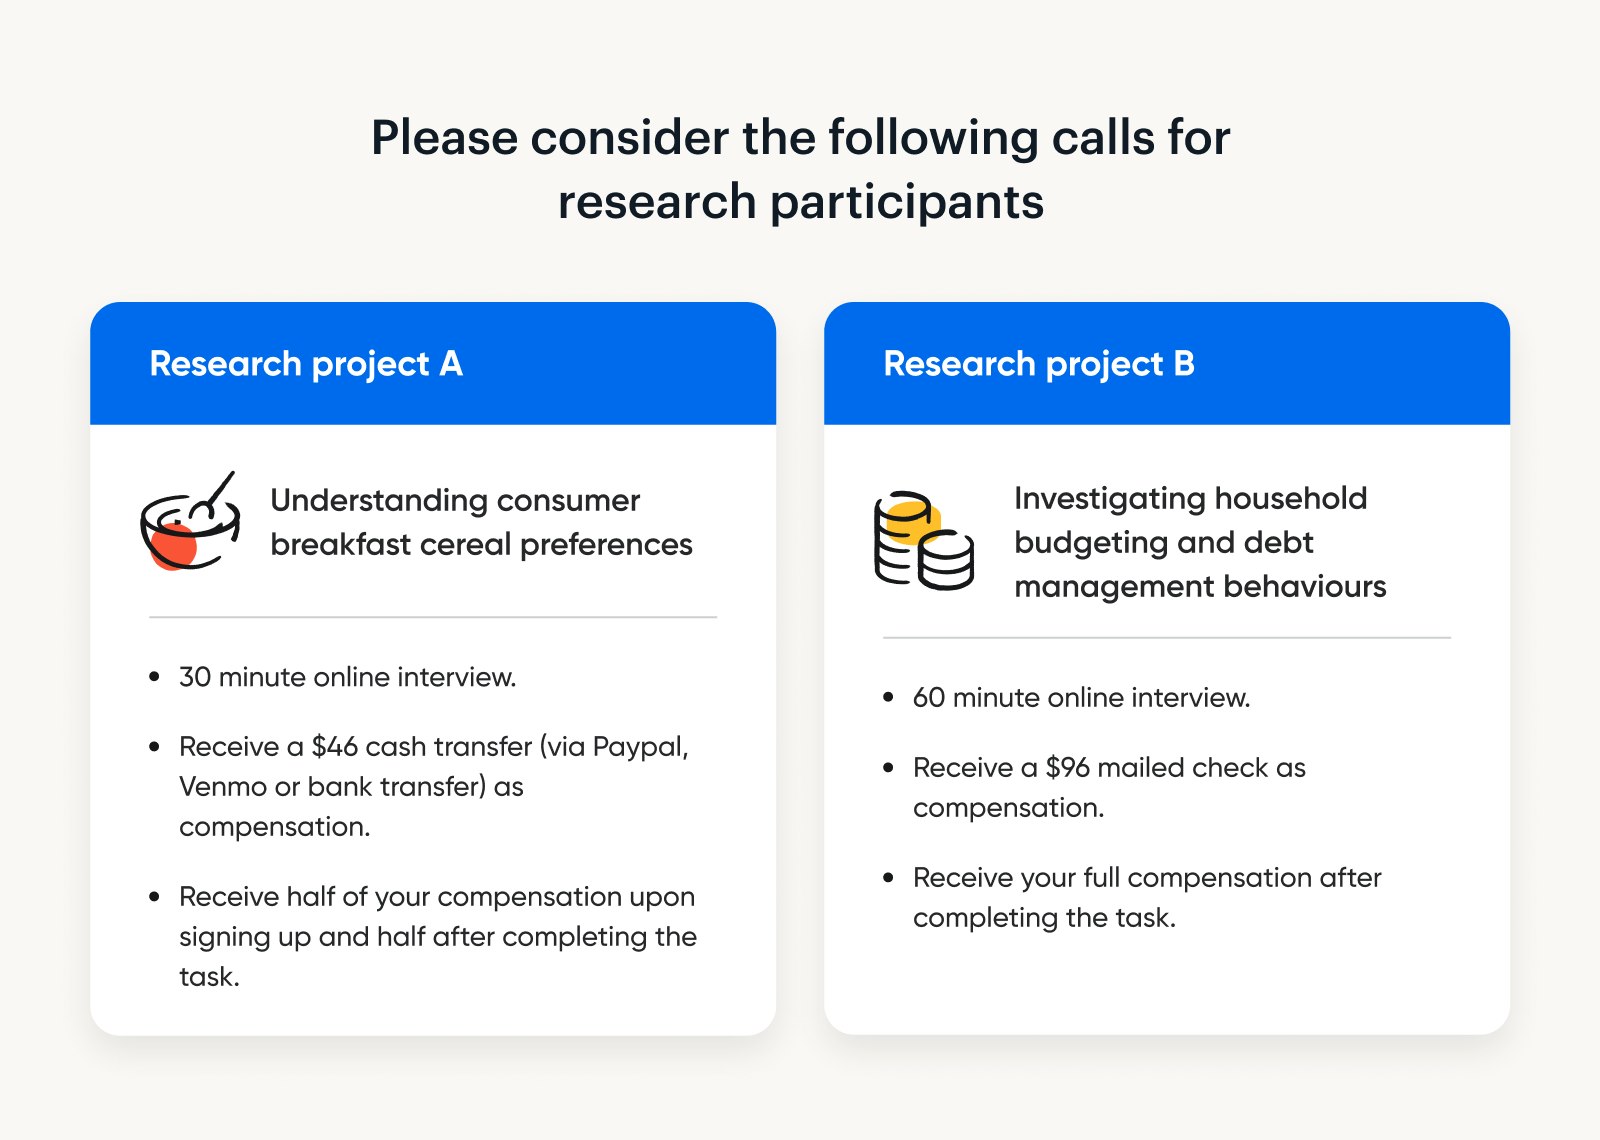
By using the discrete choice methodology, we presented participants with two options and asked them to choose which was better. This allowed us to analyze different variables and assign a dollar value to their choices.
Discrete choice set sample
| Research project A | Research project B |
|---|---|
| Understanding consumer breakfast cereal preferences | Investigating household budgeting and debt management behaviors |
| 30-minute online interview | 60-minute online interview |
| Receive a $46 cash transfer (via Paypal, Venmo, or bank transfer) as compensation | Receive a $96 mailed check as compensation |
| Get half your compensation upon signing up and the other half after completing the task | Get full compensation after completing the task |
With this information, we explored whether people prefer taking a survey vs. participating in an interview.
Turns out, people prefer studies that do not require talking to an actual person. More specifically, our participants showed a preference for online surveys over online interviews.
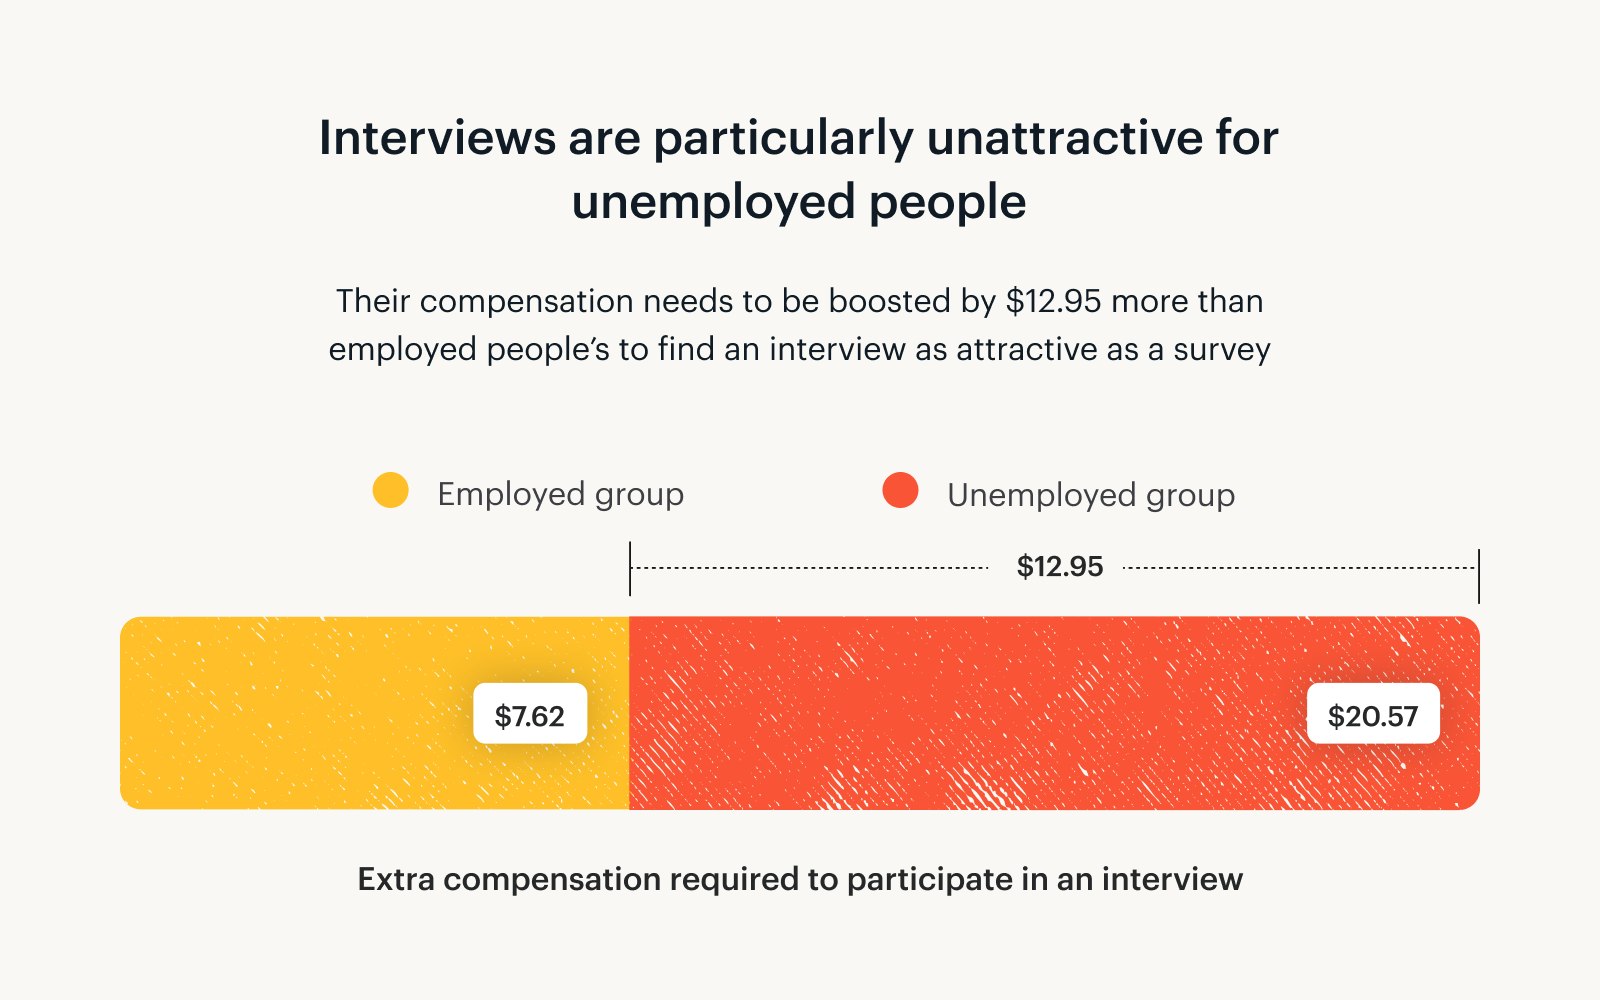
On average, online interviews need to be compensated at a flat rate of $8.66 more than surveys to be an equally attractive option.
People dealing with unemployment need to be compensated $20.57 more to do an interview compared to a survey. For employed people, the difference is only $7.62.
Step 3: Consider if your study addresses sensitive subjects
Researchers also need to think about the sensitivity of the research subject matter.
In our study, we probed how different topics affected participant motivation levels. We asked our participants to choose between two research projects: one about their breakfast cereal preferences and one about household budgeting and debt management.
For interviews and surveys that take longer than 30 minutes, we found that participants want to be compensated $3.40 more if the experiment deals with a sensitive or personal subject matter (e.g., household debt) as opposed to surface-level information (e.g., cereal preferences).
Asking someone to talk about a topic like household debt for an hour will require about $9 extra in compensation compared to asking someone about a more casual subject for the same period.
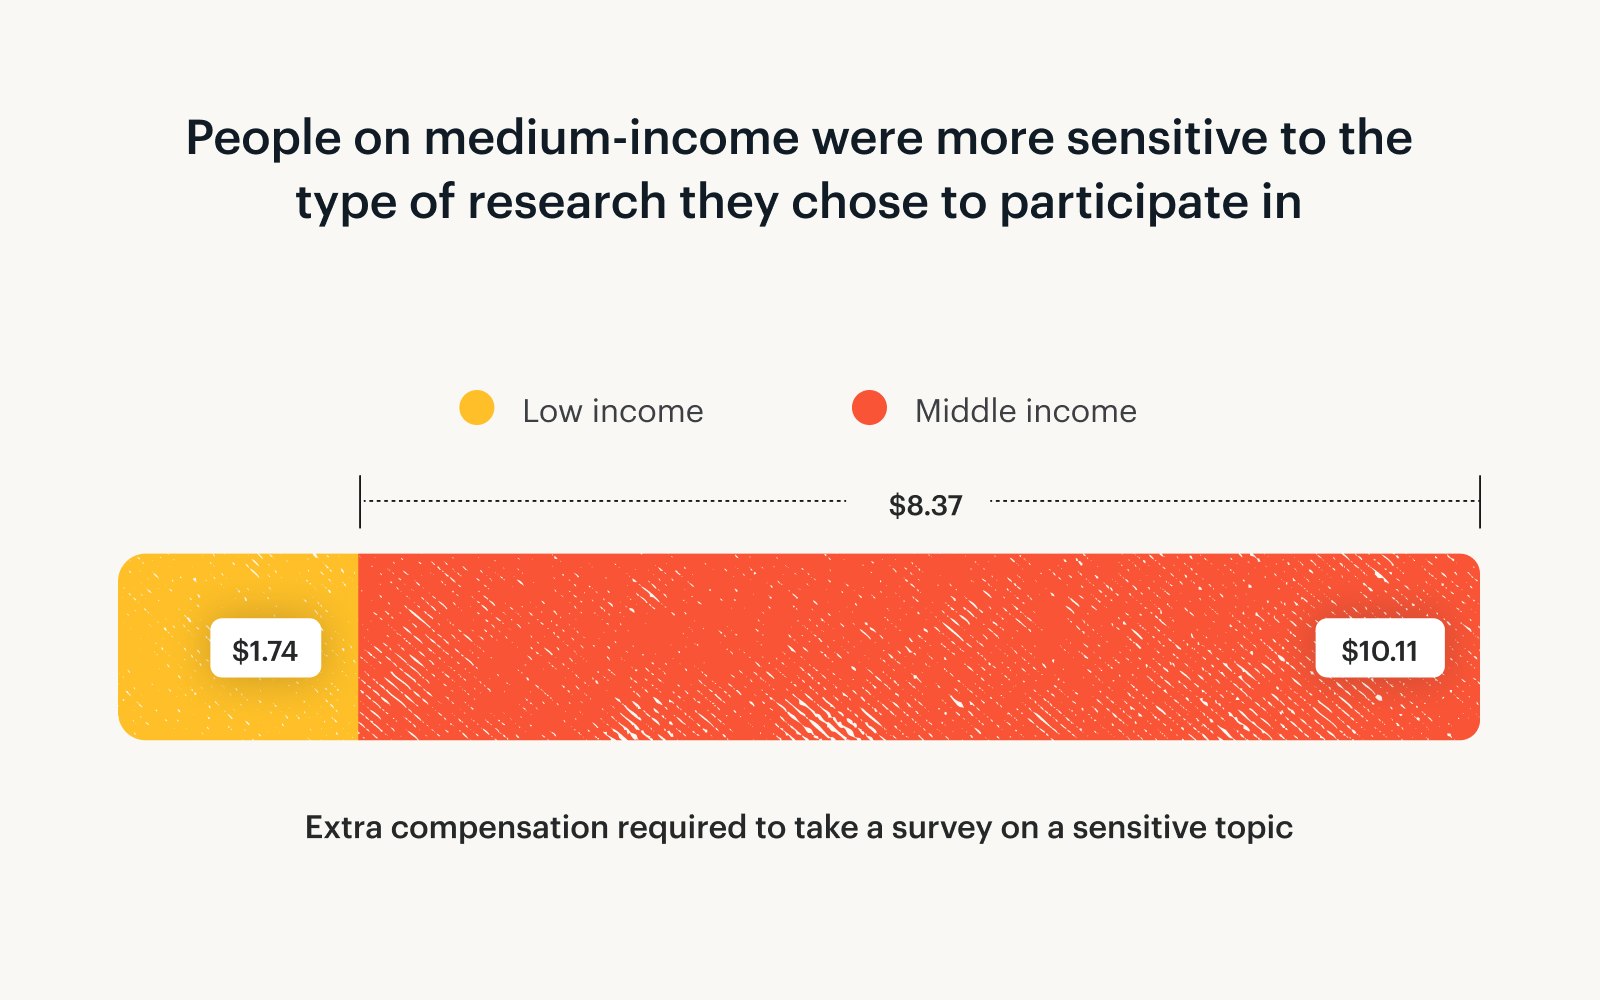
Middle-income earners (making between $50,000 and $100,000) showed the strongest sensitivity to research topic. This group would need to be compensated on average $8.37 more to take a long survey about a sensitive subject compared to someone who makes less than $50,000.
The causality of this finding is unclear. Is debt a particularly touchy subject for middle-income earners, or is cereal a particularly exciting one?
Step 4: Determine your target population
Who you target for your research matters, but some characteristics matter more than others.
Participants' income level matters
Intuitively, we expected participants’ income to affect their perception of research incentives. You might think that high earners would assign greater value to their own time, and you’d be right.

In our sample, respondents at the highest end of the wealth spectrum did have noticeably higher expectations for research compensation. Specifically, those earning $200,000 or more needed to be paid 46% more than low-income earners (under $50,000) for an incentive to have the same appeal.
On the other hand, there's one group willing to be paid less: students.
A lot of university research relies on students for their studies, which makes sense considering they're the most cost-effective group. Students expect 20% less on the dollar compared to other participants.
Step 5: Pick an incentive that appeals to research participants
We tested a variety of different incentive types to see which are the most appealing to research participants.
The table below explains what each incentive type is. It also displays the shorthand we’ll use for the remainder of this guide.
Incentive types & shorthand
| The incentives we tested | Shorthand |
|---|---|
| Cash transfer (via Paypal, Venmo, or bank transfer) | Cash transfer |
| Digital Visa prepaid card | Visa prepaid card |
| Digital gift card of your choice (choose from 2,500+ options) | Gift card or choice of gift card (This is a gift card to a single retailer that the recipient chooses from Tremendous' options.) |
| Digital Amazon.com gift card | Amazon gift card (These are the most commonly selected gift cards from the Tremendous catalog of options. This is considered a proxy for gift cards to any single retailer.) |
How incentives are delivered to participants can impact motivation levels. Overall, cash transfers are always preferred, especially if you’re hoping to engage a lower-income audience.
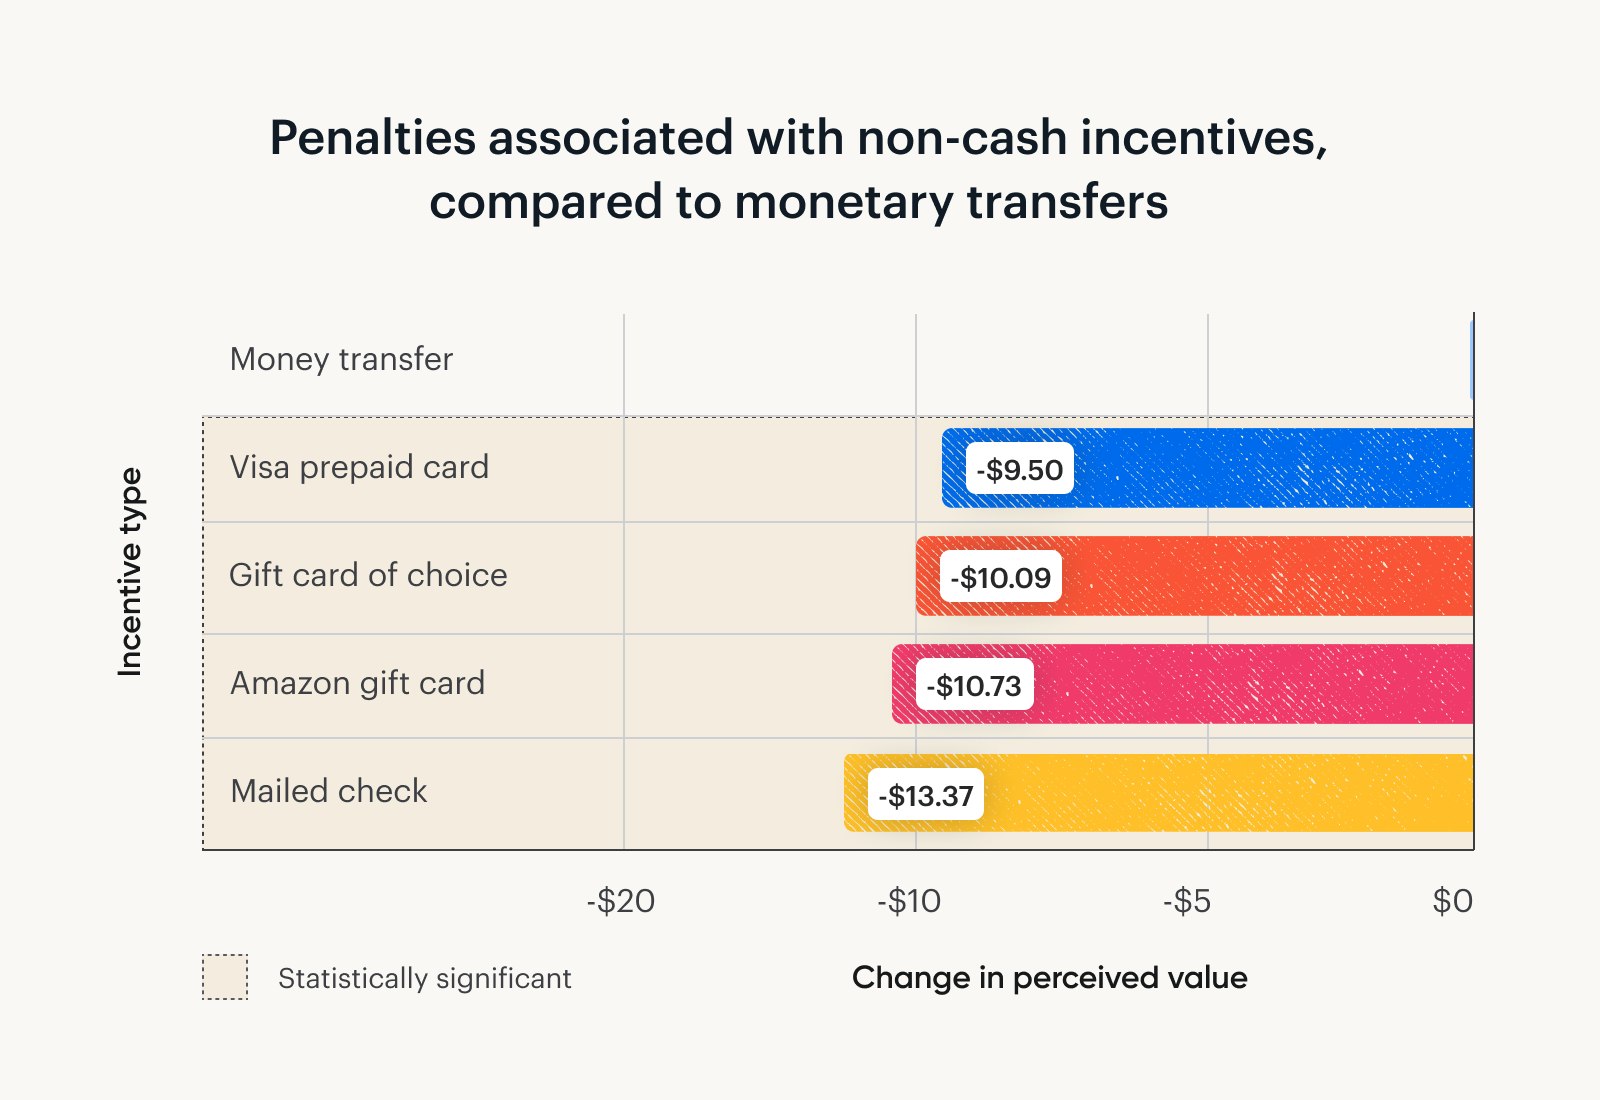
Specifically, cash offers at least $9.50 of additional value over any other incentive type we studied. This holds true for all study lengths.
On the flip side, mailed checks need to value $13.37 more for participants to consider them equal to a cash transfer.
After cash, Visa prepaid cards are the next best option, presumably due to their flexibility.
Gift cards the participant can choose themself were valued slightly more than gift cards for Amazon.
☝️ So why not just offer cash transfers?
While participants prefer options like bank transfers, PayPal and Venmo, they’re either a pain to set up or expensive to offer.
Sending money to a large number of people directly from a bank or PayPal account is tedious, fraught with errors, and risks tripping fraud alerts. Plus, international transfer options are limited.
Many researchers find that the happy medium is to offer a payout redeemable for a wide assortment of prepaid and gift cards — which, if you use Tremendous, is simple, free, and covers over 230 countries and regions.
We also found some interactions between participant characteristics and the incentives they preferred. Namely, if your target audience earns above $50,000 per year, a choice of gift cards is an equally attractive option to cash and Visa prepaid cards.
If your participants include unemployed people, avoid retailer-specific gift cards, even to large retailers like Amazon. A gift card would need to be loaded with around $37 more than a cash transfer to be valued equally (or $26 more than a Visa prepaid card).
Step 6: Ignore what doesn’t matter
It’s just as valuable to know what you don’t need to care about. Below is one such consideration, which didn’t yield any significant findings in our analyses.
Payment timing doesn’t matter
It matters how much you pay your participants, and how you pay them — but when you pay them doesn’t seem to make a difference for incentivization.
We tested a number of payment schemes, including upfront payment, payment after the study was completed, and a blend (with partial payment before and the remainder after).
No significant differences emerged between these options.
Step 7: Piece together research incentives your participant will love
When building an incentive strategy for your research, keep these rules in mind:
1. Study length has the greatest influence on how participants perceive research incentives
The relationship between study length and incentive expectations is not linear.
The longer your experiment runs, the cheaper each additional minute becomes.
If you were to increase the length of your study from 5 to 15 minutes, each of those additional 10 minutes will cost you $1.76.
But if you were to lengthen a 30-minute study to 60 minutes, each extra minute would cost only $0.71.
2. Participants require more compensation for research modalities that involve human interaction
Online interviews cost more than online surveys.
3. Studies revolving around sensitive subject matter are more expensive if they’re on the longer side
Participants expect higher compensation if you want them to talk about touchy subjects for an extended period of time.
4. Cash transfers are always preferred and offer at least $9.50 in additional value over any other incentive type we studied
Participants were least interested in mailed checks. They needed the checks to be $13.37 greater to perceive them as equal in value to cash transfers.
5. Payment scheme (whether participants were compensated before the study, after, or a blend of the two) did not affect motivation
But keep in mind that people in your target population might feel differently about this if they don't regularly participate in research.
6. Participant employment status and income level showed some differences in compensation expectations
Very high earners (over $200,000 per year) expected larger monetary incentives compared to other participants.
Students were the least expensive group, requiring 20% less than middle-income and unemployed groups to achieve the same utility.
Step 8: Use our research incentive calculator
We built a research incentive calculator based on these insights. Input the characteristics of your study, and let it recommend the optimal research incentive.
Send research incentives using Tremendous
Ready to send your next batch of participant rewards? If you don’t already, use Tremendous for research incentives — it’s fast, free, global, and it integrates with your favorite research platforms.
Sign up and start sending immediately. You can also strategize on how best to set up your program by booking a demo with our sales team.
Thousands of brands trust Tremendous to send research incentives.
Hear how Atlassian scaled their research with us.
Or read about how Forsta unlocked more international business.
We've also helped academic researchers at University at Buffalo streamline the process of dealing with IRBs with our simple approach to incentives and reporting.
Watch the webinar
About the research
Tremendous is investing in research about incentives, so we can help you make more informed decisions. To achieve this goal, we’re also being transparent about the methodology and limitations.
Benchmarking
We compared our calculator’s outputs to those of existing incentive calculators, to see how these different methodologies stacked up. Here’s what we found:
Overall, our calculator was aligned with the upper range of the comparison calculator we chose (which provided minimum, average, and maximum incentive amounts).
On average, our recommendations were $5 more than the maximum incentive recommended by the comparison calculator. This was true across study formats (surveys vs. interviews) and various study lengths.
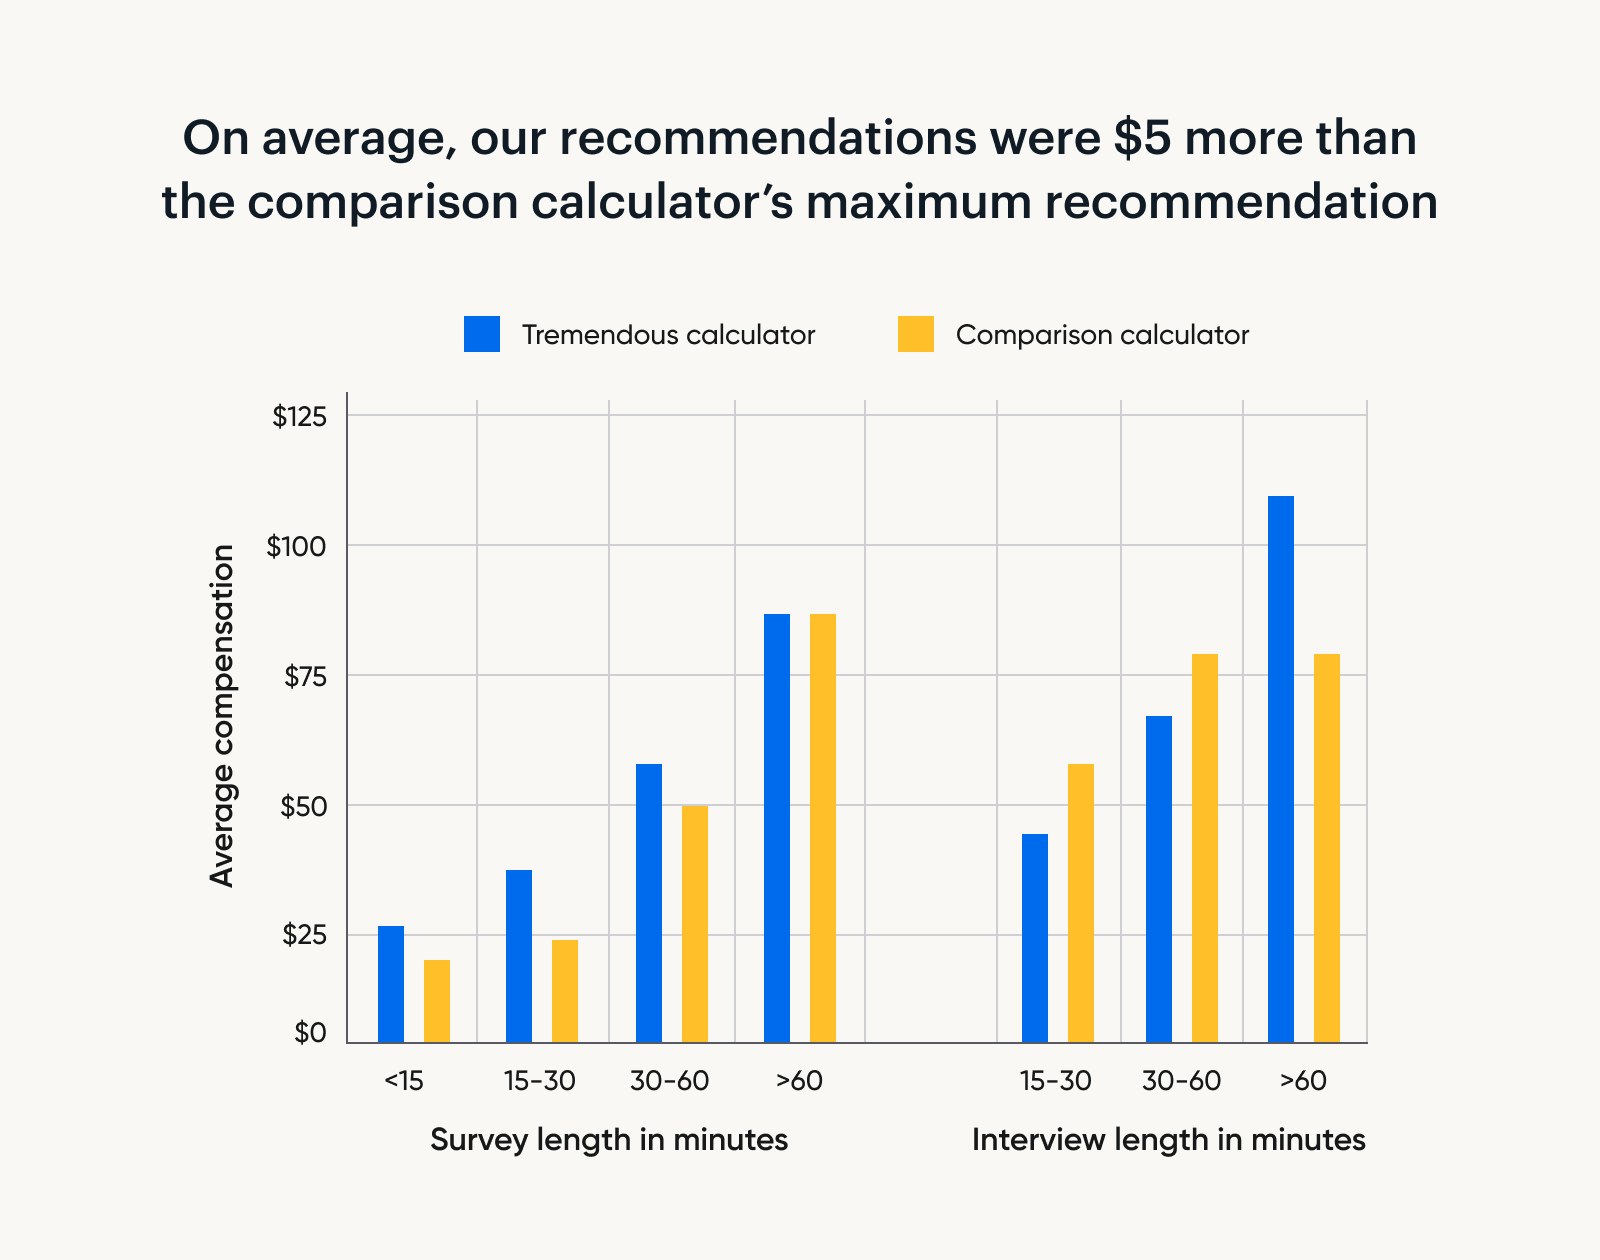
One interesting discrepancy was noted for interview incentives.
Our calculator starts off at a lower rate for short interviews. However, as interview length increases, we recommend relatively large increases in compensation.
On the other hand, the comparison calculator recommends a larger baseline incentive for short interviews, with smaller increases for longer interviews.
Given that the comparison calculator is based on observational data, this suggests that researchers may be overestimating how much money it takes to get someone through the door for an interview, and underestimating how much people value the additional time taken for longer interviews.
To further test how our calculator’s outputs compare with the current state of research incentives, we compared our recommendations with pay practices of over 150 real-world solicitations for research participants. These calls were published via two large online recruitment platforms.
We found a striking difference in the current state of research incentives across the two platforms. Specifically:
Across surveys and interviews of different lengths, the first platform’s payment practices aligned well with our recommendations. Across surveys and interviews of different lengths, their rates of compensation were between 57% and 152% of our calculator’s recommended incentive.
On the other hand, the second platform compensated participants at a much lower level. Across surveys of different lengths, their compensation clocked in somewhere between 8% and 38% of our calculator’s recommendation!
Methodology
The aims of this research, conducted in May 2023, included:
Understanding customers’ relative preference for different research incentive types and ways in which incentives are presented.
Testing whether incentive preferences differ for certain groups of participants.
Assessing how standard rates of compensation measure up with participants’ valuation of their own time.
Experimental design
We used a Discrete Choice Experiment (DCE). DCEs include a set of realistic, randomly generated options that participants choose between. For example, participants may be asked to select between a series of hypothetical research studies where types and rates of compensation and the lengths and topics of research vary randomly. By analyzing a large number of these choices, we gain insight into preference.
We used a large online research platform to test 300 people living in the US, with a balanced gender distribution. Each individual made 10 decisions, giving us a total of 3,000 data points.
Discrete Choice Experiment
We tested participant preferences for different types of research incentives, and how perceptions of research incentives varied depending on study characteristics. Participants were presented with information about two hypothetical research studies at a time, and then asked to indicate which one they would rather complete.
Example of choice set:
Following the DCE, we gathered demographic data (age, income, employment status) to test preferences between groups. During the experiment, we implemented attention checks to gauge data quality.
Analysis
Consistent with Hainmueller, 2014, we used a linear regression model to estimate the utilities/value associated with the levels of each attribute in each DCE. Only interactions that were significant at the 95% confidence level were reported. For each stage, we used separate models to test the following:
The main effect of each attribute
Interactions between attributes
Interactions between attributes and demographic factors
Each model included an estimate associated with changes in the size of the incentive. This estimate can be interpreted as the perceived value of an additional dollar added to the incentive. We used this estimated value of an additional dollar to convert the differences in perceived value between attribute levels into dollar values.


